What is a good win rate in trading? (Is 40% good?)
Win rate is the first number every trader looks at and the one most likely to fool them. A trader winning 40% of the time can be making steady money while one winning 90% of the time is slowly going broke. Both of those are just arithmetic, and once you see the arithmetic, the question “is my win rate good?” has a precise answer.
The short answer
A good win rate is any win rate above your break-even win rate, and your break-even depends on how big your average win is compared to your average loss. At a 1:2 risk/reward, 40% is profitable. At 1:1, the same 40% loses money.
So there is no single good number. There is only your win rate and your break-even, and the gap between them.
The break-even win rate formula
Risk/reward compares what you lose on an average losing trade with what you make on an average winning one. A 1:2 risk/reward means your average winner is twice the size of your average loser: you risk $100 to make $200.
The win rate you need just to break even is:
Break-even win rate = average loss ÷ (average win + average loss)
For the 1:2 trader, that is 100 ÷ (200 + 100) = 33.3%. Win one trade in three and you are flat: one $200 winner pays for two $100 losers. Win more often than that and you make money. The same formula in ratio form is 1 ÷ (1 + reward ÷ risk), which is how the table below is built.
The table: what win rate do you need to be profitable?
| Risk : reward | Your average win is | Break-even win rate |
|---|---|---|
| 1 : 0.5 | half your average loss | 66.7% |
| 1 : 1 | equal to your average loss | 50% |
| 1 : 1.5 | 1.5× your average loss | 40% |
| 1 : 2 | 2× your average loss | 33.3% |
| 1 : 3 | 3× your average loss | 25% |
| 1 : 4 | 4× your average loss | 20% |
| 1 : 5 | 5× your average loss | 16.7% |
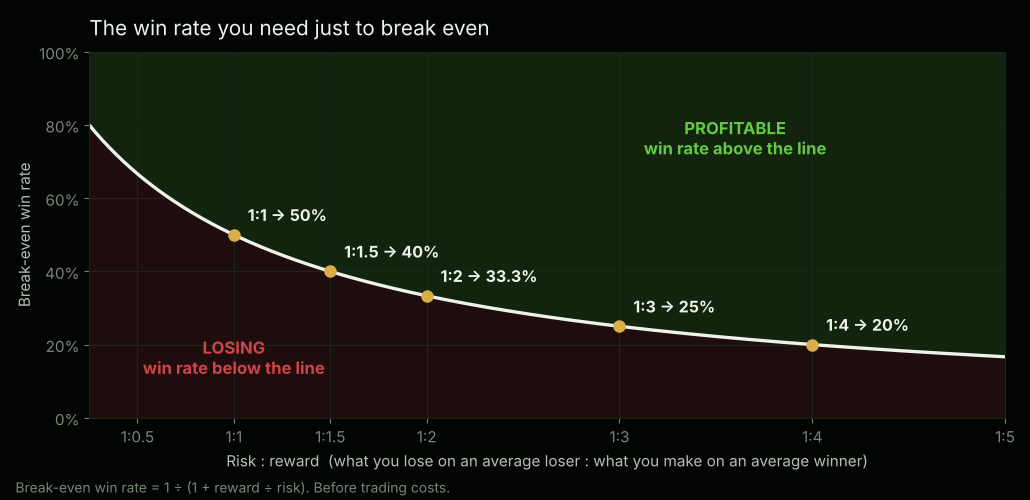
Is my win rate good? Quick answers
Turn the table around and you get the question most people actually ask. For each win rate, here is how big your average winner has to be, compared with your average loser, just to break even:
| Win rate | Average win must be more than | Risk : reward better than |
|---|---|---|
| 30% | 2.33× your average loss | 1 : 2.33 |
| 40% | 1.5× your average loss | 1 : 1.5 |
| 50% | 1× your average loss | 1 : 1 |
| 60% | 0.67× your average loss | 1 : 0.67 |
| 70% | 0.43× your average loss | 1 : 0.43 |
| 80% | 0.25× your average loss | 1 : 0.25 |
| 90% | 0.11× your average loss | 1 : 0.11 |
Is a 40% win rate good? Yes, if your average winner is more than one and a half times your average loser. This is how trend-following is designed to work: lose small and often, and let a few big winners pay for everything.
Is a 50% win rate good? Only if your winners are bigger than your losers. At exactly 1:1, 50% breaks even before costs and loses a little after them.
Is a 70% win rate good? It gives you room. Your average winner can be well under half the size of your average loser and still make money. That room is also where the next problem hides.
The high win rate trap: how 90% loses money
Picture a trader who takes small profits quickly and lets losers run, hoping they come back. Over ten trades:
- Nine winners of $100 each: +$900
- One loser of $1,000: −$1,000
That is a 90% win rate and a $100 loss. The risk/reward is 1:0.1, so the break-even win rate is 1,000 ÷ (100 + 1,000) = 90.9%. Winning nine trades in ten is not enough. It feels like success on almost every trade, which is exactly why it is so hard to notice. It is the same asymmetry behind why a 50% loss needs a 100% gain: one large loss outweighs a long run of small wins.
A very high win rate is not a warning sign by itself. A high win rate paired with an average loss many times the size of the average win is.
Expectancy: the number that actually decides it
Win rate and risk/reward are two halves of one number, the expected value of a trade, also called expectancy:
Expectancy per trade = (win rate × average win) − (loss rate × average loss)
Take a trader who wins 45% of the time, makes $300 on the average winner and loses $150 on the average loser:
(0.45 × $300) − (0.55 × $150) = $135 − $82.50 = +$52.50 per trade.
That trader’s risk/reward is 1:2, so the break-even is 33.3%. A 45% win rate sits 11.7 points above it, and that cushion is the edge. Over 100 trades, +$52.50 per trade averages out to about +$5,250. That is an average, not a promise: the actual result will swing around it, more so over fewer trades.
The same trader measured in units of risk: each loss is 1R and each win is 2R, so expectancy is (0.45 × 2) − (0.55 × 1) = +0.35R per trade. Measuring in R lets you compare strategies that use different position sizes.
For the 90% trader above: (0.9 × $100) − (0.1 × $1,000) = −$10 per trade. A worse win rate with a positive expectancy beats a better one with a negative expectancy every time.
Trading costs raise your break-even
The tables above assume every trade is free. Real trades are not: you pay the spread between the bid and the ask, sometimes a commission, and sometimes a worse fill than the price you saw. Every one of those makes each winner a little smaller and each loser a little bigger.
| Cost per trade | Net winner | Net loser | Break-even win rate |
|---|---|---|---|
| $0 | $200 | $100 | 33.3% |
| $10 | $190 | $110 | 36.7% |
| $25 | $175 | $125 | 41.7% |
Costs hurt small targets the most. A trader risking $50 to make $50 with $10 in costs nets $40 on a winner and loses $60 on a loser. The break-even win rate jumps from 50% to 60%. That is why strategies that aim for tiny moves need such high win rates to survive.
Your win rate is noise until you have enough trades
All of this assumes your win rate is real. On a small number of trades it usually isn’t: after 20 trades, a strategy with no edge at all can show anything from 28% to 72% just by luck. Before you compare your win rate to your break-even, make sure you have enough trades for it to mean something. We worked through how many in how long you should paper trade before using real money.
How to check your own numbers
- Calculate your win rate from closed trades only: winning trades ÷ total closed trades. Decide once how to count break-even trades and stick with it.
- Calculate your average win and average loss in dollars or percent, from the same trades.
- Work out your break-even: average loss ÷ (average win + average loss).
- Compare. Your win rate minus your break-even is your cushion. Positive and stable over 50 or more trades means you probably have an edge. Negative means the fix is usually the size of your losses, not how often you win.
You can do this in a spreadsheet, or practice in a simulator that tracks it for you. Social Bull shows your Win Rate, Avg Win, Avg Loss and Expected Value from your closed trades, so you can see where you sit on the curve without risking real money.
FAQ
Can you be profitable with a 30% win rate?
Yes. At a 30% win rate your average winner needs to be more than 2.33 times your average loser. A 1:3 risk/reward clears that comfortably: its break-even is 25%.
What is a good risk/reward ratio?
There isn’t one universal answer, because risk/reward and win rate trade off against each other. A wider target usually gets hit less often. What matters is the combination: the win rate you actually achieve at the risk/reward you actually take has to land above the break-even line.
Is a 50% win rate good?
Only if your average win is bigger than your average loss. At exactly 1:1, a 50% win rate breaks even before costs and loses money after them.
How many trades do you need to know your real win rate?
At least 50 closed trades under one fixed set of rules, and 100 is better. On 20 trades, luck alone can move your win rate more than 20 points in either direction.