Is your portfolio actually diversified? Three traps to check
Most people who believe they are diversified are counting tickers, not bets. Ten stocks that all rise and fall together are one position wearing ten names, and the account treats them that way the first time something goes wrong.
Here is what diversification actually means, how many stocks it takes, and the three ways a portfolio looks spread out while it isn’t.
What does it mean to be diversified?
A diversified portfolio holds investments that don’t all move together, so no single company, sector or event can sink the whole account. The number of holdings is only a rough stand-in for that. What counts is how many independent bets you hold.
How many stocks do you need to be diversified?
Fewer than most people expect, then almost no benefit after that.
A 2021 study published by the CFA Institute tested portfolios of US stocks from 2005 to 2020 and found that the answer depends on what you own. For large companies, roughly 15 stocks captured most of the available benefit. In the large-cap test, adding 30 stocks cut volatility by only three percentage points, from 20% to 17%. Smaller companies are jumpier on their own, so they needed more — around 26.
| Portfolio type | Where most of the benefit is captured | Volatility change from 30 more stocks |
|---|---|---|
| Large-cap | About 15 stocks | 20% → 17% |
| Small-cap | About 26 stocks | 32% → 25% |
But every one of those numbers assumes something easy to miss: that the stocks were picked across the market, not bunched together. Fifteen stocks from fifteen industries is diversified. Fifteen stocks from one industry is not, and no count fixes that. Which is where the traps come in.
Trap 1: ten stocks, one bet
The most common version is sector concentration, and it is easy to fall into right now because of what “the market” itself looks like.
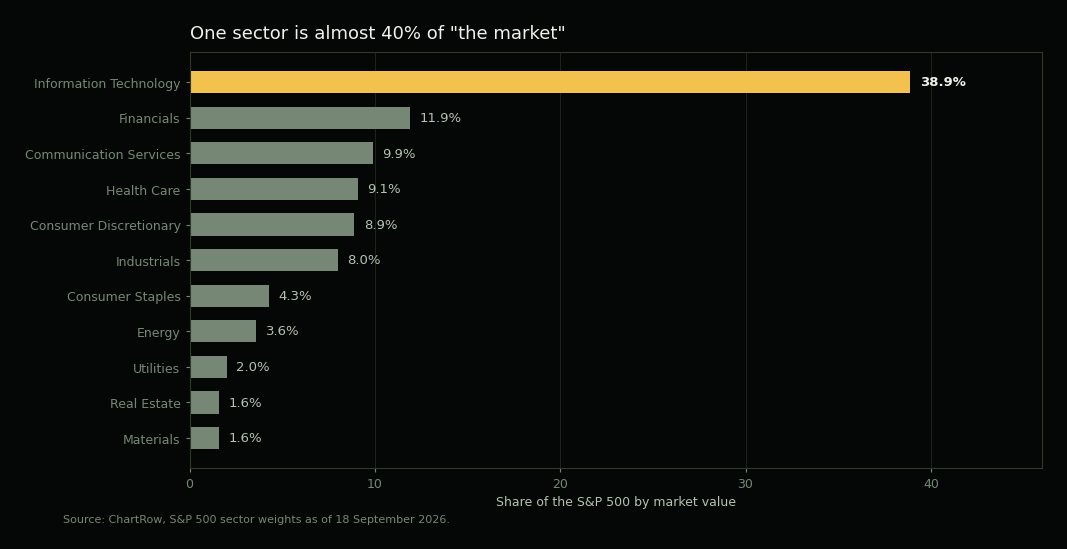
Information technology was 38.9% of the S&P 500 in mid-September 2026, according to ChartRow’s sector tracker (trackers differ slightly by source and by day). So an index fund, the default “diversified” choice, is already leaning hard into one sector before you add anything to it. Put a handful of the stocks everyone talks about on top of that, and a portfolio can easily end up with most of its money riding on one industry.
Those stocks don’t move independently. They share customers, suppliers, interest-rate sensitivity and the same story in the headlines. When the story turns, they tend to turn together.
Trap 2: funds that own the same stocks
Owning several funds feels like the safest kind of diversification. It often isn’t, because different fund names can hold the same companies underneath.
Take the two most popular index funds. As of late August 2026, SPY (the S&P 500) and QQQ (the Nasdaq-100) shared 87 holdings, and the biggest names sit near the top of both:
| Company | Weight in QQQ | Weight in SPY |
|---|---|---|
| Nvidia | 8.32% | 7.88% |
| Apple | 7.28% | 6.88% |
| Microsoft | 5.75% | 5.44% |
| Amazon | 4.45% | 3.84% |
| Alphabet | 3.22% | 3.06% |
Now picture an investor with $10,000 in SPY, $10,000 in QQQ and $2,000 in Apple shares. Three holdings, two of them broad funds. They think Apple is $2,000 out of $22,000, or about 9%.
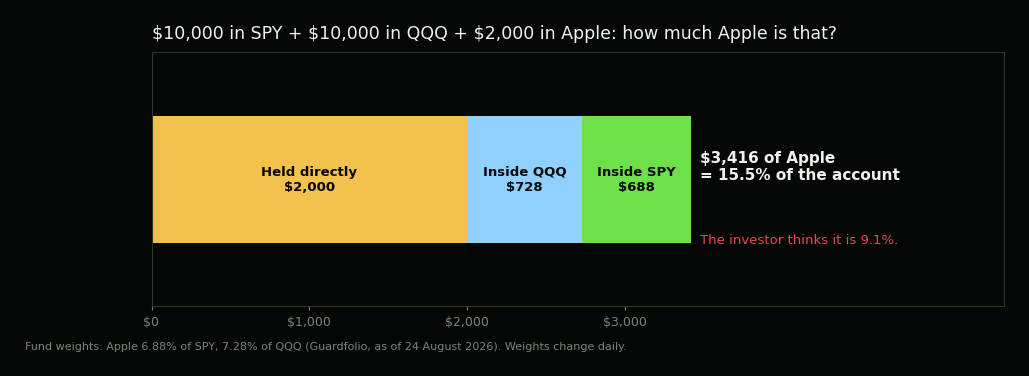
Looking through the funds, they actually hold $3,416 of Apple: 15.5% of everything they own, riding on one company. Nothing about that is hidden. It just isn’t visible from the list of tickers, which is the only thing most people ever look at.
The check takes five minutes. Every fund publishes its top holdings. Look up the top ten of each fund you own, multiply by what you have in it, and add it to any shares you hold directly. The number that comes out is your real position.
Trap 3: things that fall together
The last trap is the one that only shows up at the worst moment.
Diversification works because different investments don’t move in step. But how closely they move together — their correlation — isn’t fixed. Correlations between risky assets tend to rise during market selloffs — a 2018 paper in the Financial Analysts Journal, titled “When Diversification Fails,” studies exactly this problem. Things that looked unrelated in a calm year can all drop at once when investors sell everything to raise cash.
Two practical takeaways:
- Judge your diversification by a bad period, not a good one. Look at what each holding did during the last real selloff. If they all fell by roughly the same amount, they are not protecting each other.
- Owning more stocks can’t fix this on its own. Stocks as a group tend to fall together in a crash. Spreading across things that behave differently from stocks is a separate decision from how many stocks you own.
How to check if your own portfolio is diversified
Four questions, in order. None of them needs a spreadsheet.
- How many real bets do you hold? Group your holdings by sector. Five tech stocks count as one bet with five tickers.
- What is your biggest single company, once you look through your funds? Add direct shares to each fund’s weight times what you hold in it. It is often a name you didn’t know was that large.
- How much of the account is in your largest sector? Remember the index is already about 39% technology before you add anything.
- What did everything do in the last selloff? If the answer is “all of it fell together,” the diversification is on paper only.
None of this says a concentrated portfolio is wrong. Plenty of investors choose to concentrate on purpose. The problem is being concentrated without knowing it, because then the risk you are taking is one you never decided to take.
It is also the same arithmetic as every other kind of loss. The more of the account that falls together, the deeper the hole, and a 50% loss needs a 100% gain just to get back to even.