How long does the stock market take to recover? Every S&P 500 drop since 1972
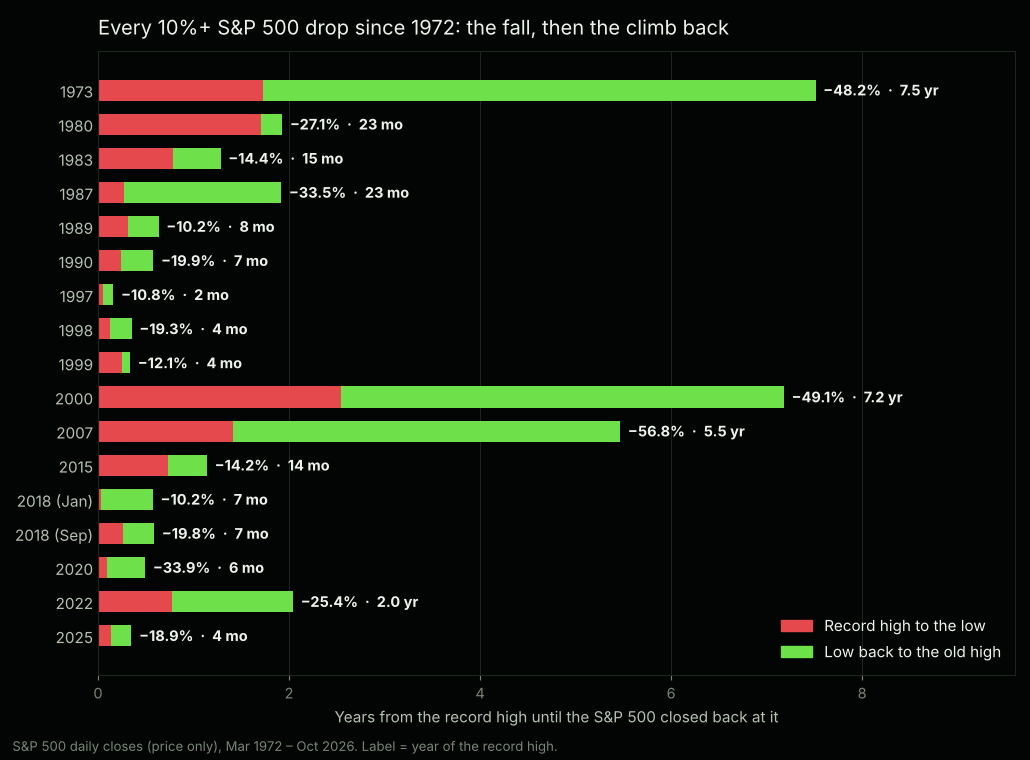
When the market falls, the question everyone asks is not really “how far?” It is “how long until I’m back to even?” So we went through every daily close of the S&P 500 since 1972, found every time it fell 10% or more from a record high, and measured two things: how long it took to hit bottom, and how long it took to get all the way back.
The short answer
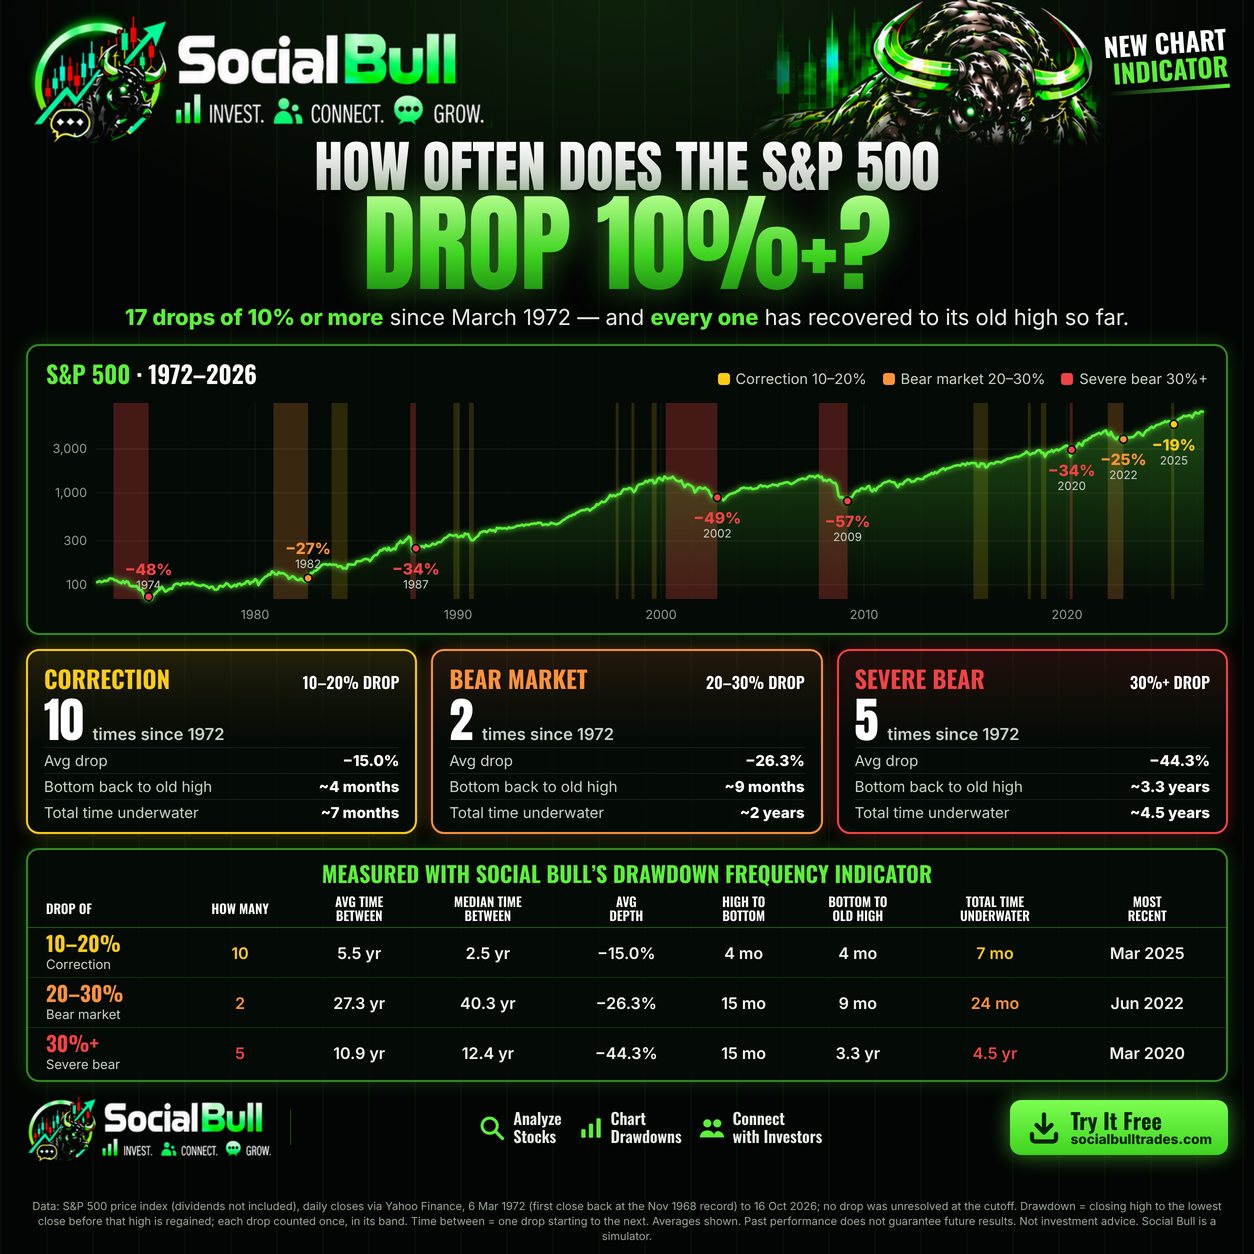
Since 1972 the S&P 500 has fallen 10% or more from a record high 17 times, and every one has recovered so far. On average, a correction (a 10–20% drop) took about 7 months to get back to its old high, a bear market of 20–30% took about 2 years, and the five crashes of 30% or more took about 4.5 years.
The typical drop was quick: half of all 17 were back at a new high within 8 months. The average is longer, 23 months, because a few deep crashes took five to seven years.
How we counted
A drop starts at a record closing high and lasts until the S&P 500 closes back at that record. Its depth is the fall to the lowest close in between. A fall that bounces and falls again before setting a new record is still one drop, not two.
- Price only. The S&P 500 index without dividends. That is the number quoted every day on the news; dividends change the picture, and we come back to that below.
- Closing prices. Intraday lows went a little deeper.
- From March 1972. That is the first day the index closed back at its November 1968 record, so every drop counted here is measured from a real all-time high. Data runs to 16 October 2026; no drop was still in progress at that date.
Why other sites list more drops. Many market tables — including one widely used corrections table — start a new drop from any recent peak, so they count around 28 drops over the same years. In 2010 and 2011, for example, the index fell 16% and 19% from short-term peaks, but it was still below its 2007 record, so in our count those were part of the long 2007–2013 recovery. Both ways are valid; they answer different questions. Ours answers the one that matters to an investor: how far below the record did it go, and when was the record back? For every drop the two methods share, the depths match to a tenth of a percent.
Every drop since 1972
| Record high | Low | Drop | High to low | Low back to high | Total time |
|---|---|---|---|---|---|
| Jan 1973 | Oct 1974 | −48.2% | 21 months | 5.8 years | 7.5 years |
| Nov 1980 | Aug 1982 | −27.1% | 20 months | 3 months | 23 months |
| Oct 1983 | Jul 1984 | −14.4% | 9 months | 6 months | 15 months |
| Aug 1987 | Dec 1987 | −33.5% | 3 months | 20 months | 23 months |
| Oct 1989 | Jan 1990 | −10.2% | 4 months | 4 months | 8 months |
| Jul 1990 | Oct 1990 | −19.9% | 3 months | 4 months | 7 months |
| Oct 1997 | Oct 1997 | −10.8% | 20 days | 39 days | 2 months |
| Jul 1998 | Aug 1998 | −19.3% | 45 days | 3 months | 4 months |
| Jul 1999 | Oct 1999 | −12.1% | 3 months | 32 days | 4 months |
| Mar 2000 | Oct 2002 | −49.1% | 2.5 years | 4.6 years | 7.2 years |
| Oct 2007 | Mar 2009 | −56.8% | 17 months | 4.1 years | 5.5 years |
| May 2015 | Feb 2016 | −14.2% | 9 months | 5 months | 14 months |
| Jan 2018 | Feb 2018 | −10.2% | 13 days | 6 months | 7 months |
| Sep 2018 | Dec 2018 | −19.8% | 3 months | 4 months | 7 months |
| Feb 2020 | Mar 2020 | −33.9% | 33 days | 5 months | 6 months |
| Jan 2022 | Oct 2022 | −25.4% | 9 months | 15 months | 2.0 years |
| Feb 2025 | Apr 2025 | −18.9% | 48 days | 3 months | 4 months |
Recovery time by size of drop
| Drop | Count | Avg depth | Fall | Climb back | Total |
|---|---|---|---|---|---|
| 10–20% | 10 | −15.0% | 4 months | 4 months | 7 months |
| 20–30% | 2 | −26.3% | 15 months | 9 months | 2 years |
| 30% or more | 5 | −44.3% | 15 months | 3.3 years | 4.5 years |
Two things stand out. First, every correction in this period was back at a new high within 16 months. Second, depth decides almost everything: the deep drops do not just fall further, they spend years climbing back. The two 20–30% drops are a small sample, so read that row as two examples rather than a rule.
How often does the S&P 500 drop 10%?
Seventeen drops of 10% or more in 54.6 years is about one every 3 years. Seven of them reached 20% or more — about one every 8 years. They cluster: three corrections came in 1997–1999, two in 2018, and then 2020, 2022 and 2025 in quick succession, with long quiet stretches in between.
If you count every 10% pullback from any recent peak instead of only from records, the market has dropped 10% more often than that, closer to once every two years. Either way, a 10% fall is a normal part of owning stocks, not a rare event.
Why the climb back takes longer than the fall
Losses and gains are not symmetrical. After a drop, the price is lower, so getting back takes a bigger percentage gain than the percentage that was lost:
| Drop | Gain needed to break even |
|---|---|
| −10% | +11.1% |
| −20% | +25.0% |
| −30% | +42.9% |
| −50% | +100.0% |
| −56.8% (2007–09) | +131.5% |
A 10% drop needs an 11% rally; the 2007–09 crash needed the index to more than double. That is the arithmetic behind why a 50% loss needs a 100% gain, and it is why the deep drops in the chart have such long green bars. The exception that proves the rule is 2020: a 34% fall, but the rebound was so fast that the whole round trip took six months.
What dividends change
Everything above is the price index. Most index funds also pay out the dividends of the companies they hold, and reinvesting them shortens every recovery, because the fund keeps buying more shares while prices are low. The effect is small for a quick correction and large for the long ones: for an investor reinvesting dividends, the 2000 and 2007 drops ended noticeably sooner than the price index shows. So treat the price-only numbers as the slower, more conservative version.
What this means for your money
History cannot tell you when the next drop starts or how deep it goes. It can tell you what to plan for:
- Money you need within a couple of years is exposed to the normal corrections in this table. A 7-month average is an average; the slow ones took over a year.
- Money you won’t touch for 10+ years has, so far, always had time to recover, including from the 7-year ones.
- Selling in the middle of a drop can turn a temporary decline into a permanent one. Every drop in the table was followed by a new high, so anyone who sold near a low and waited for things to “feel safe” again had to buy back in at higher prices to catch the recovery.
One honest caveat: this is one market over one period. Other markets have taken far longer — Japan’s main index took about 34 years to regain its 1989 peak. Past recoveries do not guarantee future ones.
Check any stock’s own history
Individual stocks are a different animal: they can fall further than the index and some never come back. Social Bull’s Drawdown Frequency indicator runs this same count on any chart — how many times it fell 10%, 20% or 30%+, the typical wait between drops, how deep they went and how long it took to recover — so you can see what a stock has actually put its holders through before you buy it.
FAQ
How long do stock market corrections last?
For the S&P 500 since 1972, a correction of 10–20% took about 4 months on average from the record high to the low, and about 7 months in total to get back to a new high. The fastest round trip took 2 months (1997); the slowest took 15 months (1983–85).
How long do bear markets last?
The seven drops of 20% or more since 1972 took about 15 months on average to reach the bottom, and anywhere from 6 months (2020) to 7.5 years (1973) to get back to the old high.
Has the stock market always recovered?
The S&P 500 has recovered from every drop since 1972 so far. That is history, not a promise: other markets, like Japan’s after 1989, took decades.
How often does the stock market drop 10%?
Measured from record highs, the S&P 500 has dropped 10% or more about once every 3 years since 1972, and 20% or more about once every 8 years.