Time in the market vs timing the market
Hold the S&P 500 for one day and you are about as likely to be up as to be down — 53.3% of days finish green. Hold it for twenty years and, historically, you have not lost. Same index, same companies, same everything. The only variable that moved was patience.
That is the whole argument, and it is worth looking at the numbers rather than repeating the slogan.
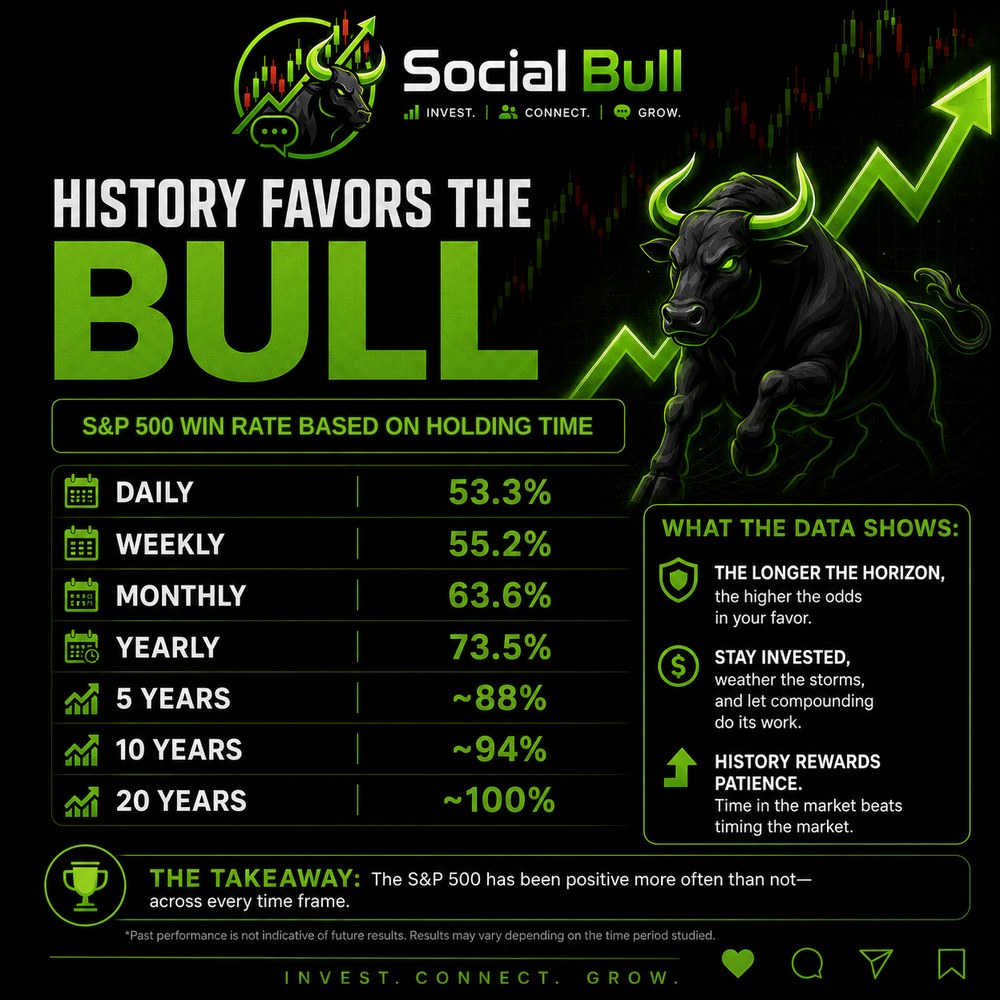
What the win rate actually says
Look at the shape of it. One day is 53.3% — barely better than a coin. A week is 55.2%, which is still noise. A month gets you to 63.6%. A year, 73.5%. Five years, about 88%. Ten, about 94%. Twenty, essentially all of them.
The interesting part is that nothing in that list is a prediction. Every row is the same asset. Nobody picked better companies at the twenty-year mark. The odds improved because the holding period got longer, and for no other reason.
Why waiting changes the odds
Two things are happening to a stock price at once, and they grow at different speeds.
The first is noise — sentiment, positioning, somebody's forced sale, a headline. Day to day this is almost the entire movement. The second is the slow accumulation of earnings, which barely registers over a day and is almost the entire story over a decade.
The reason the win rate climbs is that those two do not scale together. Noise grows with the square root of time: four times the days, only twice the scatter. Earnings growth grows with time itself — four times the years, four times the accumulation. Every day you hold, the signal pulls further ahead of the noise. The chart above is not really about the stock market. It is what that arithmetic looks like when you plot it.
It also explains why timing feels so plausible and works so badly. Over a day you are betting on the noise, which is the part nobody can forecast. Over twenty years you are betting on the earnings, which is the part that has been fairly dependable.
What this chart leaves out
Every version of this post you have read stops at the previous section. It should not, because there are three things the win rate does not tell you.
Green does not mean good. A win on this chart just means the number went up. It does not mean the money buys more than it used to. The real bar is inflation, and the gap between those two can be twenty years wide: the worst long stretch on record ended in the summer of 1982 and returned about 1.4% a year after inflation. Positive. Also two decades of standing still. So the question to ask of any return is not "did it go up", it is "did it beat inflation" — and the chart above cannot answer that one.
This is one country's history. The S&P 500 is the index of the economy that won the twentieth century, and we are reading its record backward, knowing it won. Japan's Nikkei peaked in 1989 and took more than thirty years to get back there. Anyone who drew this same chart in Tokyo in 1989 would have had a beautiful one.
And it assumes you actually held. The chart describes an index. It does not describe a person watching their account fall by a third and deciding to sit still. The math is not the hard part. Doing nothing on the days when doing nothing feels insane is the hard part.
This is where buying on a schedule helps — the same amount every month, whatever the price. Not because it beats investing all at once; historically it usually has not, on average. It helps because it takes the decision away from you. You stop needing to be right about one date, and a falling market quietly becomes the month your money buys the most shares instead of the month you panic.
None of this makes the case weaker. It makes it a real one instead of a slogan. Long holding periods improve the odds enormously, and they never make losses impossible. Both are true, and the second one is why people who only heard the first one sell at the bottom.
The part you can actually check
You do not have to take a chart of the index on faith. You have your own version of it, and it is more useful, because it is about your decisions rather than the market's.
Social Bull tags every fill and shows the win rate for each tag, so you can ask the question directly: how have your quick trades done against the ones you sat on? Most people have a strong opinion about that and have never checked it. The trade journal is there because remembering selectively is the default, and a win rate by tag is the cheapest cure for it.
Run it on your own history. If your one-week trades and your one-year trades look like the top and bottom of that chart, you have learned something about yourself that no index can tell you.
Social Bull is the research half, not just another paper-trading account.
Every ticker gets value lines — that stock's own ten-year average P/E, P/S and P/B drawn straight over its price, so you can see whether it is cheap by its own standard instead of guessing what a "normal" multiple is. Most free tools tell you the P/E is 18. Almost none tell you what 18 means for that company.
Underneath that: a full terminal on every name, a screener across about sixteen thousand US stocks with strategy backtesting, and a trade journal that tags what you did and shows the win rate for each tag — the only honest way to find out whether a strategy works or you are remembering the good ones. Net worth and budgets live beside the portfolio instead of in another app. There is a feed, messages and an opt-in leaderboard too, so you can watch what people actually do rather than what they say afterward.
Free, no card, and every position is simulated — real prices, virtual money.
Open the app