How long should you paper trade before using real money?
Ask this question on any trading forum and you get every answer from “two weeks” to “a year,” usually from people who are sure of it. The reason nobody agrees is that the question is measured in the wrong unit. Time doesn’t tell you whether a strategy works. Trades do.
The short answer
Paper trade until you have closed at least 50 trades under one fixed set of rules, those trades show a positive expected value, and you kept following your rules through a losing streak. Depending on how often you trade, that can take three weeks or six months.
The rest of this post is why each of those three conditions matters, and how to check them on your own results.
How do you paper trade?
Paper trading is placing simulated trades on real market prices without putting money at risk. A simulator holds a virtual balance, fills your orders at market prices, and tracks the profit and loss as if it were real. Done well, it looks like this:
- Start with the balance you will actually fund. If you plan to trade $3,000, don’t practice with $100,000. Position sizes, and the way a loss feels, don’t scale.
- Write your rules down before the first trade. What makes you buy, where you get out if you’re wrong, where you take profit, and how much of the account goes into one position.
- Log every trade with its reason. Not just the ticker and price, but which rule triggered it. That is what lets you tell a bad strategy apart from a good strategy you didn’t follow.
- Count closed trades, not days. Which brings us to the real answer.
Why the answer is a number of trades, not weeks
Every trade is a single sample of what your strategy does. A handful of samples can say almost anything, even about a strategy with no edge at all.
Take a strategy that is a pure coin flip: it wins exactly half the time. Here is the range of win rates it will show you, 95% of the time, depending on how many trades you have taken:
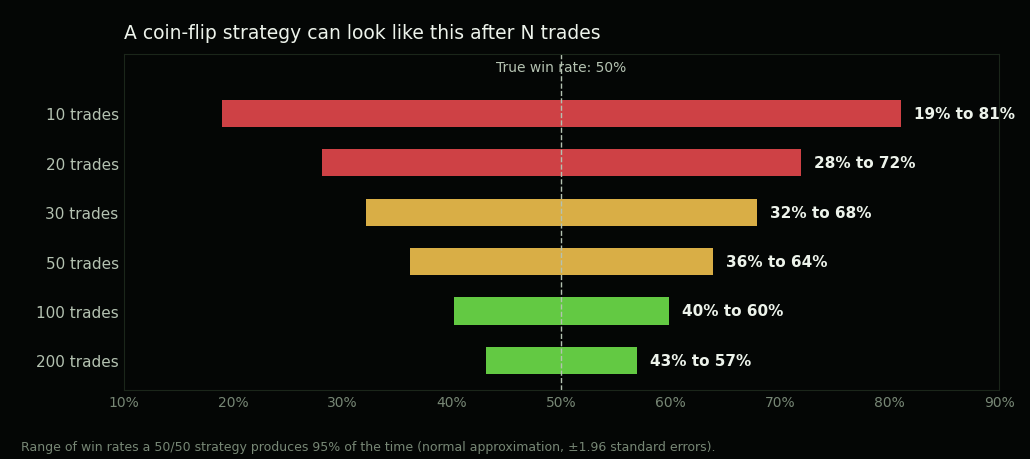
After 10 trades, a coin flip shows a win rate of 70% or better about one time in six. That is how many people “prove” a strategy in two weeks and then watch it fall apart with real money: the strategy didn’t change, the sample just got bigger.
Fifty trades is a floor, not proof. Even after 50, a coin flip still shows 60% or better about one time in ten, which is why the checklist below looks at the size of your wins and losses, not just how often you win. A hundred trades is better.
So how long does 50 trades take?
That depends entirely on how often you trade, which is why the time-based answers on forums are all over the place:
| Style | Pace | Time to 50 trades |
|---|---|---|
| Day trading | 3 per day | About 3–4 weeks |
| Active swing trading | 5 per week | About 10 weeks |
| Swing trading | 2 per week | About 6 months |
| Position trading | 2 per month | About 2 years |
That last row is worth sitting with. If you are a long-term investor buying a few positions a year, paper trading can’t give you a meaningful sample in any reasonable amount of time, and it isn’t the right tool. Your edge is mostly time in the market, not trade selection.
The checklist: you’re ready when all of these are true
1. At least 50 closed trades on one set of rules
The count resets every time you change the rules. Thirty trades with one setup and twenty with a tweaked version is two small samples, not one big one. Tweaking is fine; it’s how strategies improve. It just means the clock starts over.
2. A positive expected value per trade
Win rate on its own is the most misleading number on the screen. What matters is what you make on the average trade, which combines how often you win with how much you win and lose:
Expected value per trade = (win rate × average win) − (loss rate × average loss)
Two strategies make the point:
| Win rate | Avg win | Avg loss | Expected value | |
|---|---|---|---|---|
| Strategy A | 40% | +8% | −4% | +0.8% per trade |
| Strategy B | 65% | +3% | −7% | −0.5% per trade |
Strategy B wins almost two trades out of three and slowly loses money. Strategy A loses more often than it wins and makes money, because its losses are cut at half the size of its wins. Most beginners would pick B from the win rate alone. It’s the same asymmetry behind why a 50% loss needs a 100% gain: the size of the losses decides more than how many there are.
A useful shortcut: the win rate you need just to break even is your average loss divided by your average win plus your average loss. For Strategy A, that is 4 ÷ (8 + 4), or about 33%. Winning 40% of the time against a 33% break-even is a real cushion. Winning 65% against Strategy B’s 70% break-even is a slow leak.
3. You followed your rules through a losing streak
Losing streaks are not a sign that something is broken. They are arithmetic. Over 50 trades:
- A strategy that wins 50% of the time has a 55% chance of at least five losses in a row somewhere in there.
- A strategy that wins 40% of the time, like Strategy A above, has an 84% chance of five straight losses, and a 63% chance of six.
So the real test isn’t whether you hit a streak. You almost certainly will. It’s what you did during it. If you skipped valid setups, doubled your size to win it back, or quietly changed the rules, your paper results describe a strategy you won’t actually follow once the money is real. Go back and check the trades logged during your worst stretch.
One more test: remove your best trade
Take your single biggest winner out of the results and recalculate. If the strategy goes from profitable to losing, you don’t have a strategy yet. You have one lucky trade and 49 others. A real edge survives losing its best day.
What paper trading can’t teach you
Passing the checklist means your strategy probably works. It doesn’t mean you’ll trade it the same way with money on the line. Paper trading leaves out a few things on purpose, because it can’t include them:
- Fear and greed. Closing a losing paper trade costs you nothing. Closing a real one means admitting a real loss, and that is exactly the moment people stop following their rules.
- Imperfect fills. A simulator fills your order at the quoted price. A real market order pays the spread between the bid and the ask, and on thinly traded stocks it can fill noticeably worse than the price you saw. Limit orders may not fill at all.
- Delayed data. Many simulators, including free ones, run on quotes that can be delayed. Fine for swing trading; a real gap for day trading, where a few minutes is the whole trade.
None of those are reasons to skip paper trading. They are reasons to treat going live as one more stage of testing, not a finish line.
How to make the switch
- Go live small. Trade a fraction of your planned size, small enough that a full losing streak wouldn’t change how you trade.
- Keep the exact same rules. Going live is not the moment to try the idea you had last week.
- Compare your first 20–30 live trades to your paper stats. Similar win rate and average win and loss means the strategy survived contact with real money. A big gap usually means fills or discipline, and the trade log tells you which.
- Scale up in steps, only while the live numbers keep matching.
And if live results drift well below your paper results, going back to paper isn’t failing. It’s the cheapest place to find out what changed.