Why Buffett's first rule is “never lose money”
Lose 50% and you need 100% to get back to even. Not 50%. That is the entire rule, and it is arithmetic rather than attitude.
The quote everyone knows is “Rule No. 1: never lose money. Rule No. 2: never forget rule No. 1.” It gets passed around like a motivational poster — be careful out there. It is not that. It is a statement about a function that bends, and the bend is worth looking at.
How much do you need to gain to break even after a loss?
To get back to even after losing L percent, you need to gain L ÷ (1 − L). A 10% loss needs an 11.1% gain. A 25% loss needs 33.3%. A 50% loss needs 100%. A 75% loss needs 300%. The deeper the loss, the faster the required gain runs away from it.
| Loss | Gain needed to break even | What that means |
|---|---|---|
| 10% | 11.1% | A good quarter |
| 20% | 25.0% | A good year |
| 30% | 42.9% | A very good year |
| 40% | 66.7% | An exceptional year |
| 50% | 100.0% | Double your money |
| 60% | 150.0% | Years |
| 70% | 233.3% | More than triple |
| 80% | 400.0% | Five-bagger |
| 90% | 900.0% | Ten-bagger, to end up where you started |
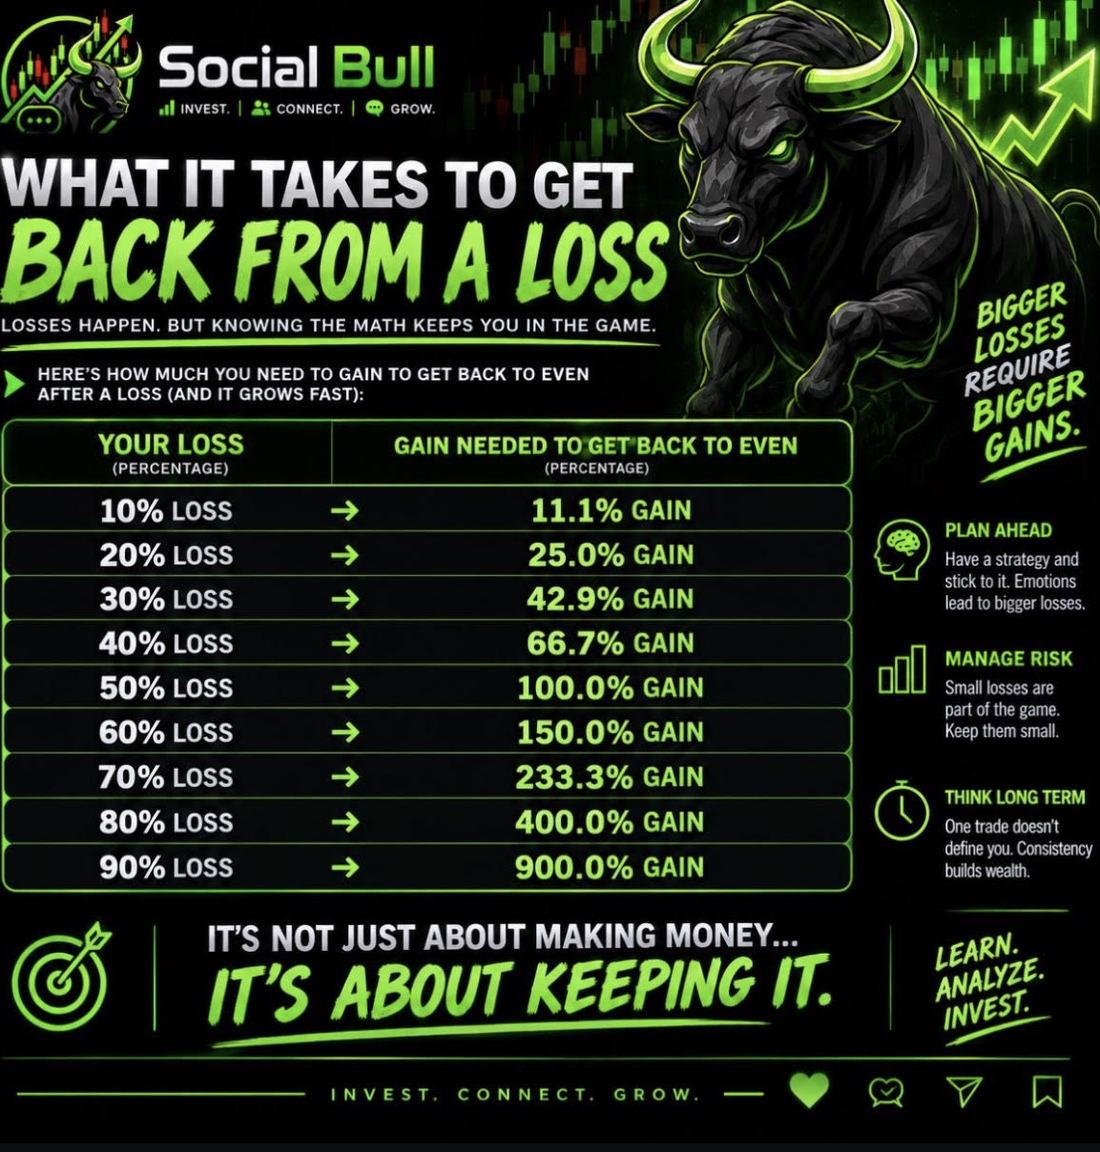
Notice that the top of the table and the bottom of it are describing different situations. Losing 20% is a setback you trade your way out of. Losing 70% is not a setback — it is a new and much harder job.
Why isn't a 50% gain enough to recover a 50% loss?
Because the two percentages are taken from different numbers.
Start with $10,000 and lose 50%. You are at $5,000. That loss was measured against $10,000 — it cost you $5,000. The recovery has to be earned on what is left, and $5,000 of gain on a $5,000 base is 100%.
Same dollars in both directions. Half the base on the way back. That is the whole asymmetry: every percentage you lose is taken from a bigger number than the percentage you need to earn to replace it.
What Buffett actually means by “never lose money”
He does not mean never hold something that goes down. Berkshire's own shares have fallen by roughly half more than once — a fact Buffett has pointed out himself in a shareholder letter rather than hidden. Anyone who has held equities for thirty years has watched a position drop by a third.
The distinction that matters is between a quote and a loss. A price that fell is a quote. A business that permanently lost its ability to earn is a loss. The first one comes back. The second one is what the table is about.
Read that way, the rule is about avoiding the handful of things that turn a quote into a loss:
- Size. No single position big enough that being wrong about it ends the account.
- Leverage. The one thing that can take you off the bottom of the table entirely, where the loss is more than 100% and there is no gain that fixes it.
- Price. A great company bought at a silly number is how a permanent loss gets dressed up as a good decision.
The way the rule gets misread
Here is the trap, and it is the reason this post exists.
“Never lose money” gets heard as “never sell at a loss” — and that produces the exact behavior the table punishes.
Somebody is down 8%. Selling would make it real, so they hold. Down 20%: selling now means admitting the first decision was wrong too, so they hold. Down 40%: the only thing that gets them back is a 67% gain, and by this point they are holding for reasons that have nothing to do with the company.
Refusing to take a small loss is the mechanism that produces a large one. An 11% gain is a decent quarter. A 150% gain is years, and a different set of skills from the ones that got you into a 60% hole.
So the rule is not “never realize a loss”. It is closer to: never let a loss walk down the table to the part where the math stops being on your side.
What the loss-recovery table leaves out
It assumes you stopped adding money. The table describes one sealed pot. If you are still contributing every month, your account gets back to even well before the position does, because the new money is buying the lower price. Two different questions, and the table only answers one of them.
Averages lie about order. Up 50% and then down 50% is not flat. $10,000 becomes $15,000, then $7,500. The average of +50 and −50 is zero, and you are down a quarter. That is the same asymmetry wearing a different hat, and it is why a steadier 8% can finish ahead of a wilder 10%.
And it says nothing about what to do next. The math tells you what a recovery costs. It does not tell you whether this particular position will deliver it, and those two get conflated constantly. “It needs to double to get back to even” is a fact about arithmetic, not a forecast about the business — and it is just as true of a company that is about to recover as one that never will.
It is also worth putting next to the other half of the picture: over long holding periods the odds move strongly in your favour, which is what the S&P 500's win rate by holding period actually shows. Both things are true. Time improves the odds enormously, and it never makes losses impossible.
Check it against your own trades
Everyone believes they cut their losers quickly. Almost nobody has looked.
Two numbers settle it, and they are both sitting in your own trade history. The first is your average loss against your average win — if the average loss is the bigger of the two, the table is already working against you and no win rate rescues it. You can be right most of the time and still go backwards. The second is your deepest drawdown: how far the account actually fell, and what it cost to climb back.
Social Bull tags every fill and reports the win rate for each tag, so “I cut my losers” stops being a belief about yourself and becomes a number you can read.
And the whole thing is a simulator — real prices, virtual money. Which makes it the one place where finding out what a 50% drawdown does to you costs a lesson instead of a decade.
Find out what your losses cost you — before they cost you anything.
Social Bull is the research half, not just another paper-trading account. The trade journal tags what you did and shows the win rate per tag, which is the only honest way to tell a strategy that works from a memory that flatters you.
Underneath that: value lines on every ticker — that stock's own ten-year average P/E, P/S and P/B drawn straight over its price, so you can see whether it is cheap by its own standard instead of guessing what a “normal” multiple is. A full terminal on every name, a screener across about sixteen thousand US stocks with strategy backtesting, and net worth and budgets beside the portfolio instead of in another app. There is a feed, messages and an opt-in leaderboard too, so you can watch what people actually do rather than what they say afterward.
Free, no card, and every position is simulated.
Open the app